How to Set Up Your First TradingView Chart: A Complete Beginner's Guide
Understanding the TradingView Interface
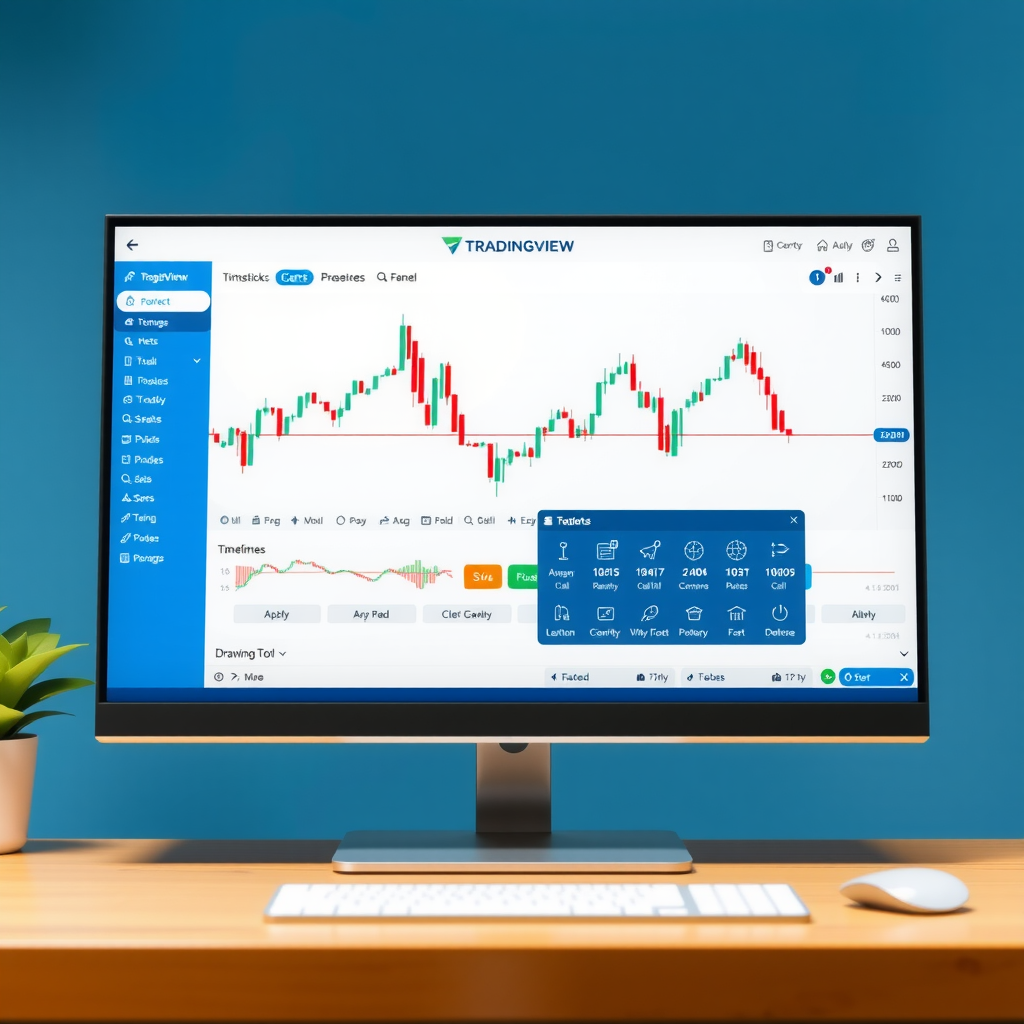
Before diving into chart creation, it's essential to familiarize yourself with the TradingView interface. When you first open TradingView, you'll see a clean workspace divided into several key areas: the main chart area in the center, the toolbar at the top, the symbol search bar, and the side panel for additional tools and features.
The interface is designed to be intuitive, with most commonly used features easily accessible. The top toolbar contains chart type options, timeframe selectors, and drawing tools. On the left side, you'll find the main navigation menu, while the right side typically displays watchlists and market data.
Pro Tip:Take a few minutes to explore the interface without making any changes. Hover over different buttons and icons to see tooltips that explain their functions. This initial exploration will help you feel more comfortable as you begin setting up your chart.
Step 1: Selecting Your Trading Instrument
The first step in creating your chart is choosing which financial instrument you want to analyze. TradingView offers access to thousands of markets, including stocks, forex pairs, cryptocurrencies, commodities, and indices.
How to Search for Symbols
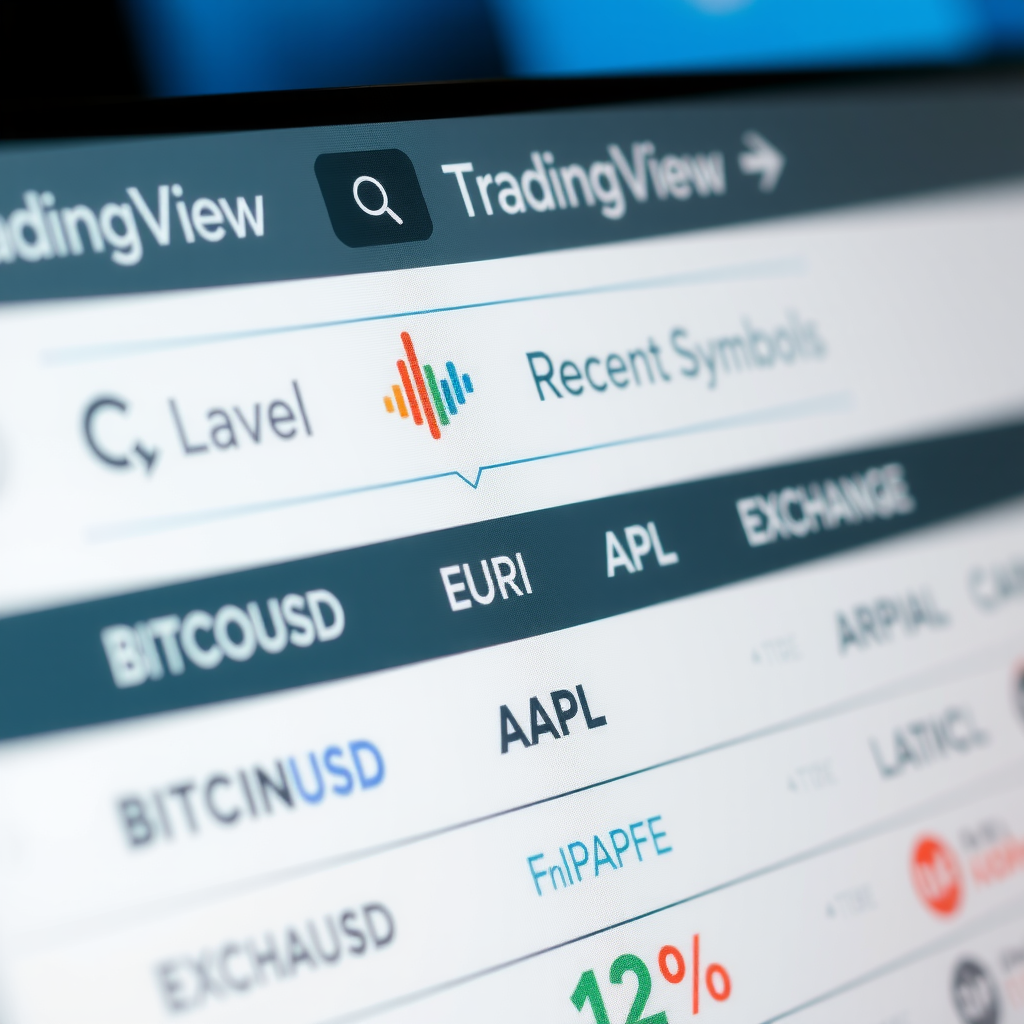
At the top of your screen, you'll see a search bar displaying the current symbol (by default, it might show something like "BTCUSD" or "SPX"). Click on this search bar to open the symbol search window. You can type the name or ticker symbol of any instrument you want to analyze.
As you type, TradingView will display matching results from various exchanges and markets. For example, if you type "AAPL," you'll see Apple Inc. stock from different exchanges. Select the one that matches your preferred exchange (typically NASDAQ for US stocks). The chart will immediately update to display your chosen instrument.
Step 2: Choosing Your Chart Type
TradingView offers multiple chart types, each providing different perspectives on price movement. The chart type selector is located in the top toolbar, typically showing an icon that represents the current chart style.
Popular Chart Types for Beginners
1Candlestick Charts
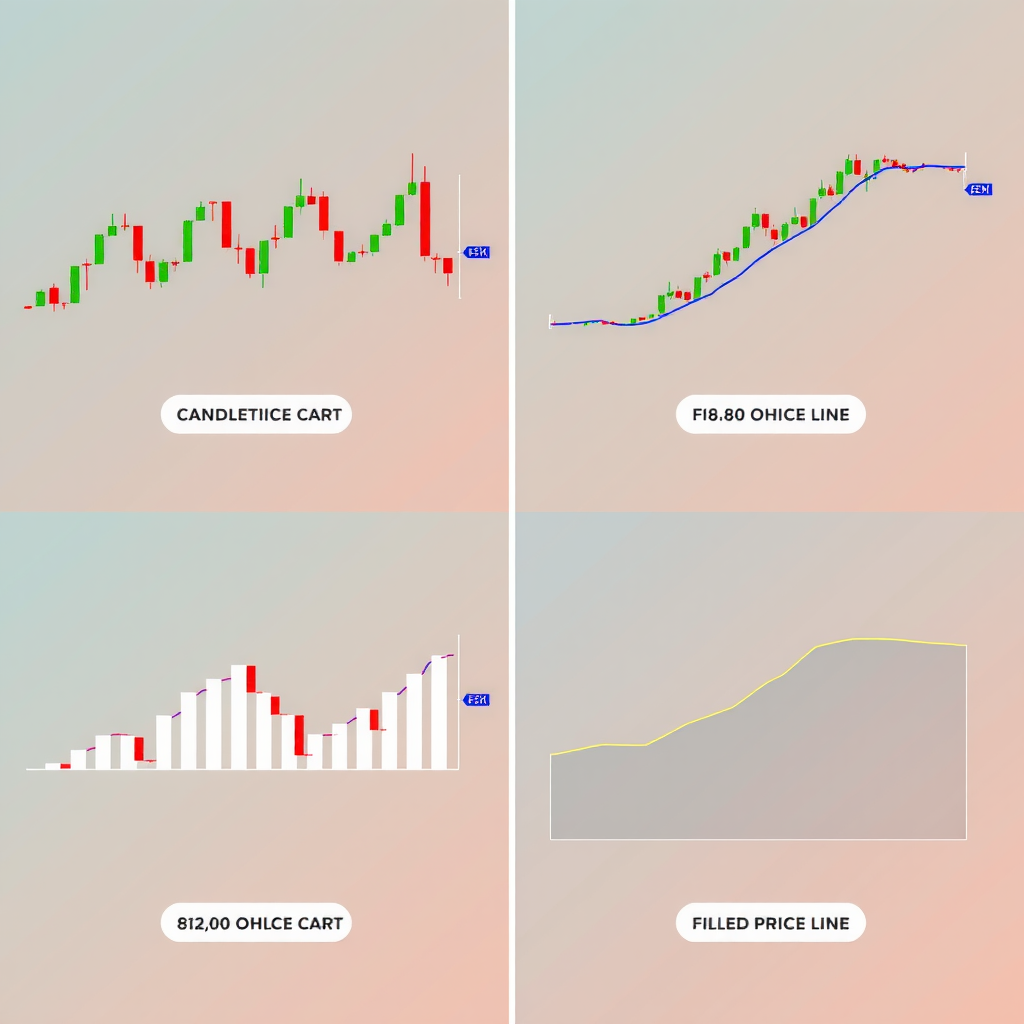
The most popular choice among traders, candlestick charts display four key price points for each time period: open, high, low, and close. Green (or white) candles indicate the price closed higher than it opened, while red (or black) candles show the opposite. This chart type provides rich information at a glance and is excellent for identifying patterns and trends.
2 Line Charts
Line charts connect closing prices with a continuous line, creating a clean, simple view of price movement. This chart type is ideal for beginners who want to focus on overall trends without the visual complexity of candlesticks. It's particularly useful for long-term analysis and identifying major support and resistance levels.
3 Bar Charts
Bar charts display the same information as candlesticks but in a different format. Each bar shows the high and low prices with small horizontal ticks indicating the opening and closing prices. While less visually intuitive than candlesticks, some traders prefer bars for their cleaner appearance and easier pattern recognition.
For beginners, we recommend starting with candlestick charts as they provide the most comprehensive information while remaining relatively easy to understand. You can always experiment with different chart types later to find what works best for your trading style.
Step 3: Setting Your Timeframe
The timeframe determines how much price data each candle or bar represents. This is one of the most important settings on your chart, as it dramatically affects how you view and interpret price movements.
Understanding Common Timeframes
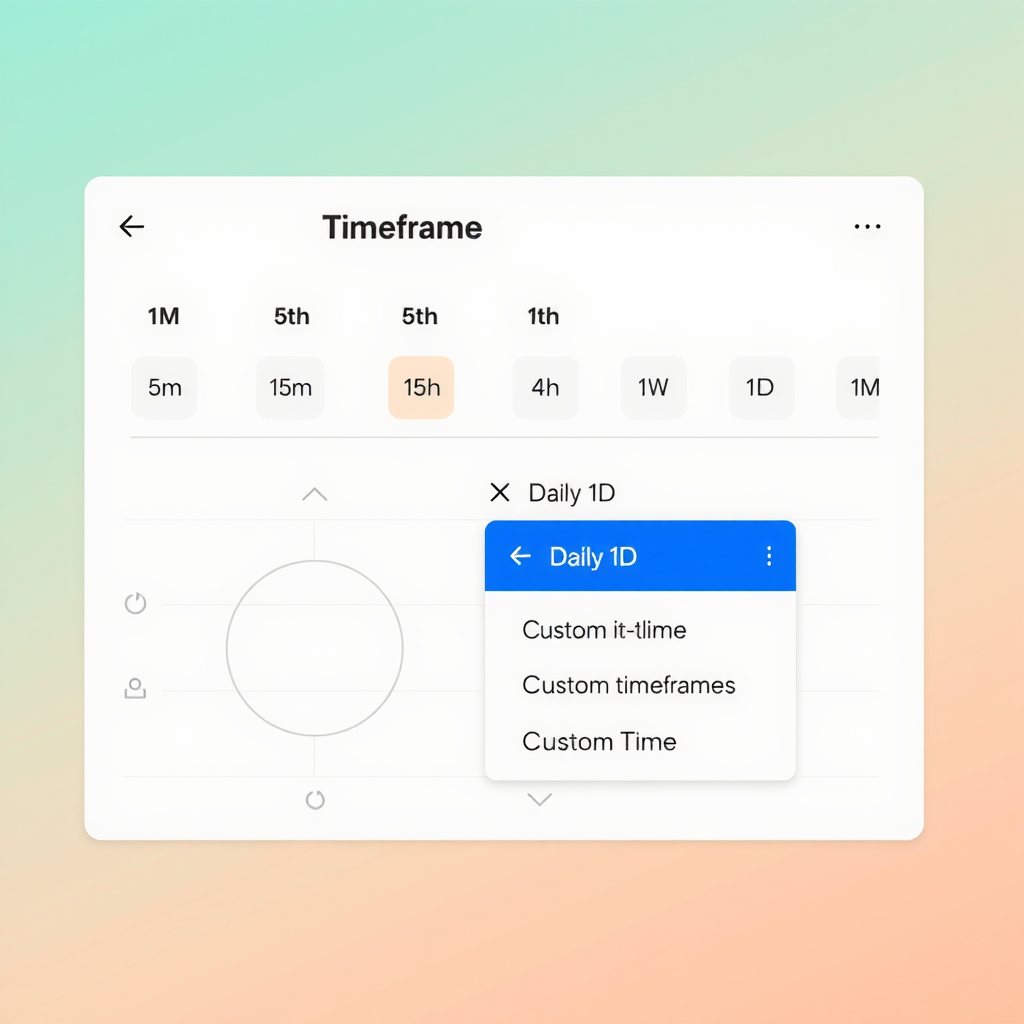
The timeframe selector is located in the top toolbar, usually displaying options like "1m," "5m," "15m," "1h," "4h," "1D," "1W," and "1M." These represent minutes, hours, days, weeks, and months respectively. Each candle on your chart will represent the selected time period.
Short-term timeframes (1m to 15m):These are used by day traders who make multiple trades within a single day. They show rapid price movements and require constant monitoring. As a beginner, these timeframes can be overwhelming and are generally not recommended until you have more experience.
Medium-term timeframes (1h to 4h):These timeframes are popular among swing traders who hold positions for several days to weeks. They provide a good balance between detail and the bigger picture, making them suitable for beginners who want to understand market dynamics without being glued to their screens.
Long-term timeframes (1D to 1M):Daily, weekly, and monthly charts are ideal for position traders and investors who take a long-term view. The daily timeframe is particularly popular as it filters out much of the market noise while still providing enough detail for analysis. We recommend beginners start with the daily (1D) timeframe.
Beginner Recommendation:Start with the daily (1D) timeframe for your initial analysis. This gives you a clear view of trends without overwhelming you with too much information. Once you're comfortable, you can explore other timeframes to refine your analysis.
Step 4: Navigating Your Chart
Once your chart is set up with your chosen symbol, chart type, and timeframe, you need to know how to navigate it effectively. TradingView provides several intuitive ways to move around and zoom in on your chart.
Basic Navigation Controls
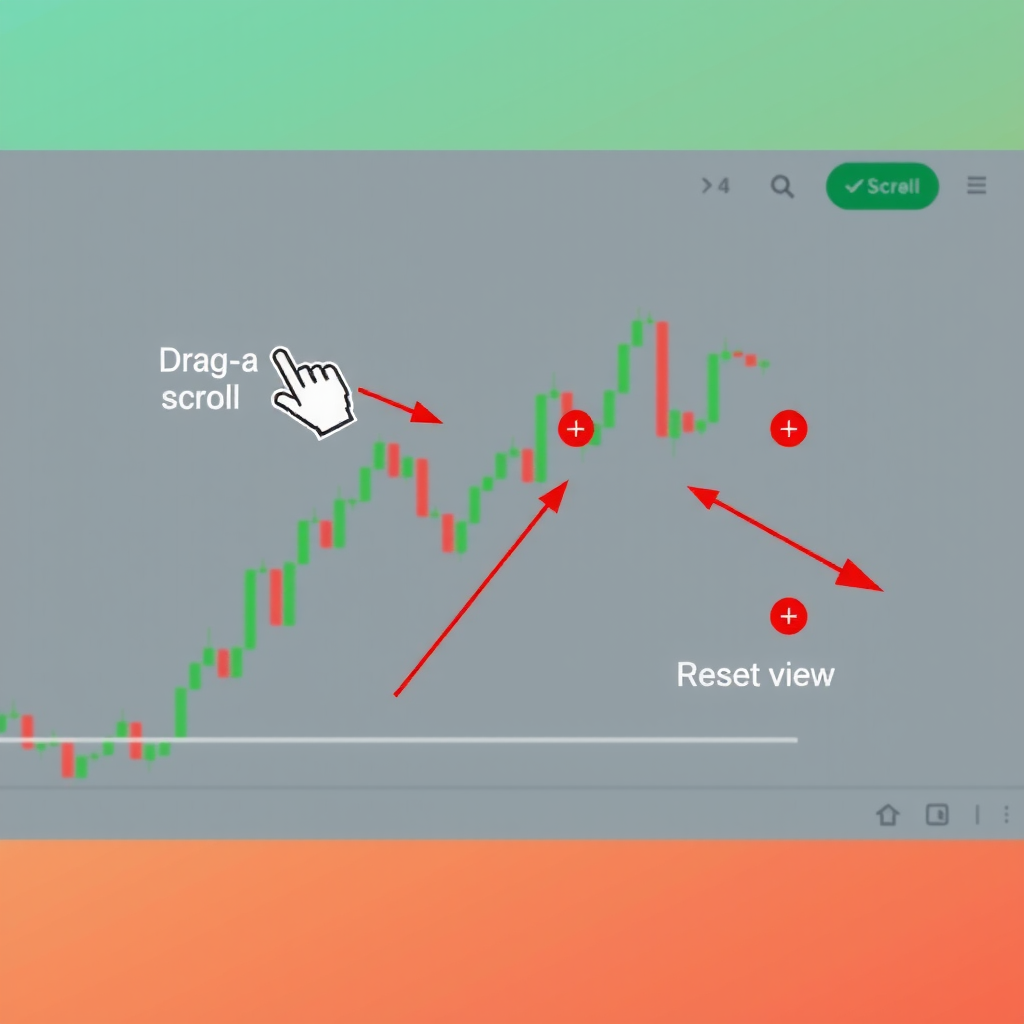
Scrolling through time:Click and drag anywhere on the chart to move backward or forward in time. This allows you to view historical price data or return to the most recent prices. You can also use your mouse wheel to scroll horizontally through the chart.
Zooming in and out:Use your mouse wheel while holding the Ctrl key (Cmd on Mac) to zoom in and out on the chart. This changes how many candles are visible on your screen. Zooming in shows more detail for recent price action, while zooming out gives you a broader historical perspective.
Adjusting price scale:The price scale on the right side of the chart can be adjusted by clicking and dragging it up or down. This is useful when you want to focus on a specific price range or see more of the chart's price history.
Resetting the view:If you get lost while navigating, look for the "Reset Chart" button or press the Home key to return to the default view showing the most recent price data.
Step 5: Customizing Your Chart Appearance
TradingView allows extensive customization of your chart's appearance to match your preferences and improve readability. Access the chart settings by clicking the gear icon or right-clicking on the chart and selecting "Settings."
Essential Customization Options
Background and candle colors:You can change the background color from white to dark mode, which many traders prefer for extended viewing sessions. You can also customize the colors of bullish (up) and bearish (down) candles. The default green and red work well, but some traders prefer blue and orange or other combinations.
Grid lines and scales:Grid lines help you quickly identify price levels and time periods. You can adjust their visibility, color, and spacing in the settings. The price scale can be set to logarithmic (useful for long-term charts with large price movements) or linear (standard for most analysis).
Session breaks:For markets that close (like stock markets), you can choose whether to show gaps between trading sessions or connect them with a line. Showing session breaks provides a more accurate representation of price action.
Timezone settings:Make sure your chart displays times in your local timezone. This is particularly important if you're trading markets in different time zones. You can adjust this in the chart settings under the "Timezone" option.
Important Note:Don't spend too much time perfecting your chart appearance initially. Start with the default settings or make minimal changes, and adjust as you gain experience and discover what works best for your eyes and trading style.
Step 6: Saving Your Chart Layout
After setting up your chart exactly how you want it, you'll want to save this configuration so you don't have to recreate it every time you open TradingView. The platform makes this easy with its chart saving feature.
Look for the "Save" button in the top toolbar (it looks like a cloud or disk icon). Click it and give your chart a descriptive name, such as "Daily BTC Analysis" or "AAPL 4H Chart." You can create multiple saved charts for different instruments and timeframes, making it easy to switch between your various analyses.
Your saved charts will appear in the "Chart Layouts" menu, accessible from the top toolbar. This feature is incredibly useful as you develop your trading routine and want to quickly access your preferred chart setups.
Common Beginner Mistakes to Avoid
As you begin working with TradingView charts, be aware of these common pitfalls that can confuse beginners:
Using Too Many Timeframes at Once
Beginners often jump between multiple timeframes, creating confusion. Start with one primary timeframe and stick with it until you're comfortable with basic analysis.
Ignoring the Price Scale Settings
The auto-scale feature can sometimes make small price movements look dramatic. Learn to read the actual price values on the right side of your chart to maintain perspective.
Not Checking the Exchange
Different exchanges can show slightly different prices for the same instrument. Always verify you're looking at data from your preferred or most relevant exchange.
Forgetting to Save Your Work
TradingView doesn't automatically save your chart configurations. Remember to save your layouts regularly, especially after making significant customizations.
Next Steps in Your TradingView Journey
Congratulations! You've successfully set up your first TradingView chart. This is an important milestone in your trading education. Now that you're comfortable with the basics, you're ready to explore more advanced features.
Your next steps should include learning about drawing tools (like trend lines and support/resistance levels), adding technical indicators (such as moving averages and RSI), and understanding how to analyze price patterns. Each of these skills builds upon the foundation you've established with your chart setup.
Remember, becoming proficient with TradingView is a gradual process. Don't rush to learn everything at once. Spend time each day practicing with your chart, experimenting with different settings, and observing how prices move across various timeframes. This hands-on experience is invaluable for developing your analytical skills.
Key Takeaways
- Start with a simple setup: choose one instrument, one chart type (candlesticks recommended), and one timeframe (daily recommended for beginners)
- Learn the basic navigation controls before adding complexity to your charts
- Customize your chart appearance for comfort, but don't obsess over aesthetics initially
- Save your chart layouts regularly to preserve your configurations
- Practice daily with your chart to build familiarity and confidence
- Be patient with yourself – mastering chart analysis takes time and consistent practice
Setting up your first TradingView chart is just the beginning of an exciting journey into market analysis. With this foundation in place, you're well-equipped to continue learning and developing your trading skills. Keep practicing, stay curious, and don't hesitate to experiment with different settings as you discover what works best for your trading style.
Ready to continue your TradingView tutorial beginner journey?
Explore more step-by-step guides on how to start TradingView and master essential trading tools.