Understanding TradingView Indicators: Top 5 Tools Every Beginner Should Know
When you first open TradingView, the sheer number of available indicators can feel overwhelming. With hundreds of technical analysis tools at your fingertips, where do you even begin? This comprehensive guide breaks down the five most essential indicators that every beginner trader should master first.
Quick Tip:Don't try to use all indicators at once. Start with one or two, understand how they work, and gradually add more to your analysis toolkit as you gain confidence.
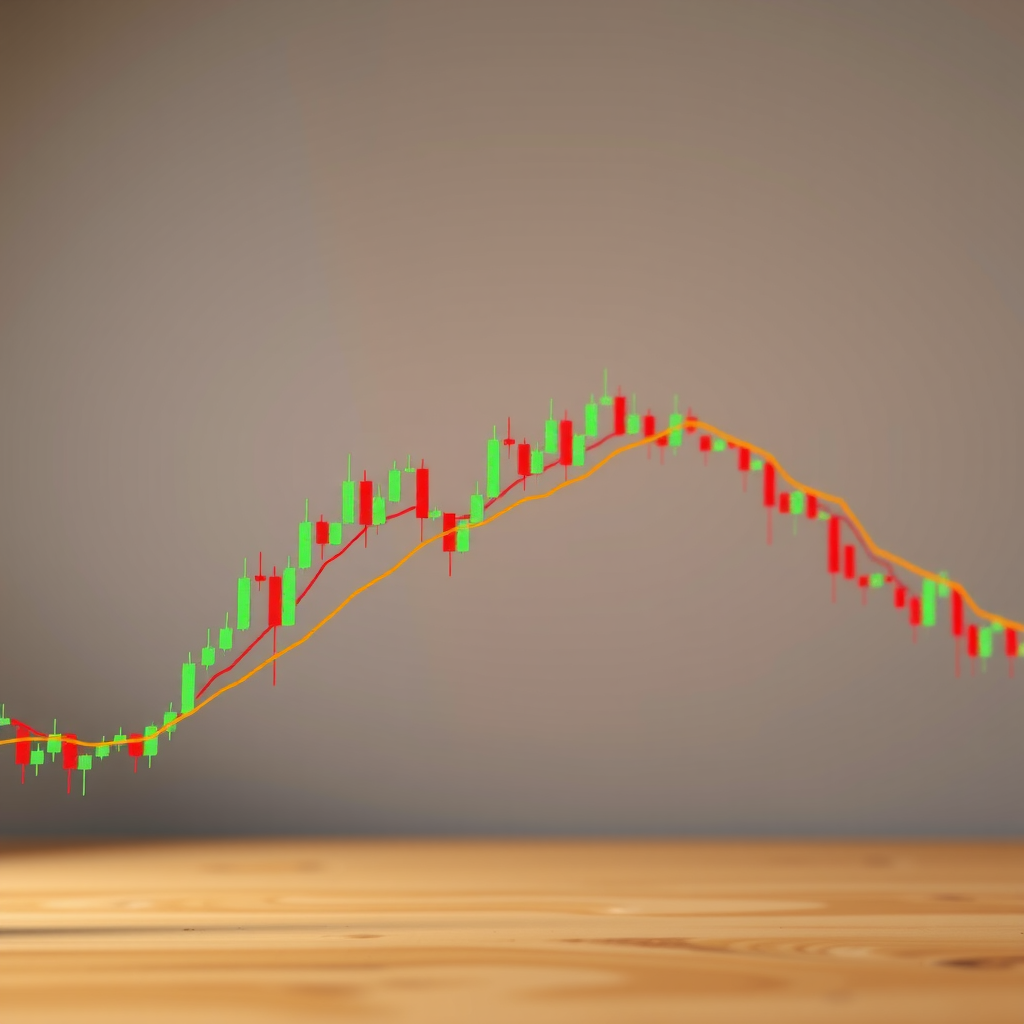
1. Moving Averages (MA): Your First Line of Trend Analysis
Moving Averages are arguably the most popular and beginner-friendly indicators in trading. They smooth out price data by creating a constantly updated average price, helping you identify the overall direction of a trend without getting distracted by short-term price fluctuations.
What Moving Averages Tell You
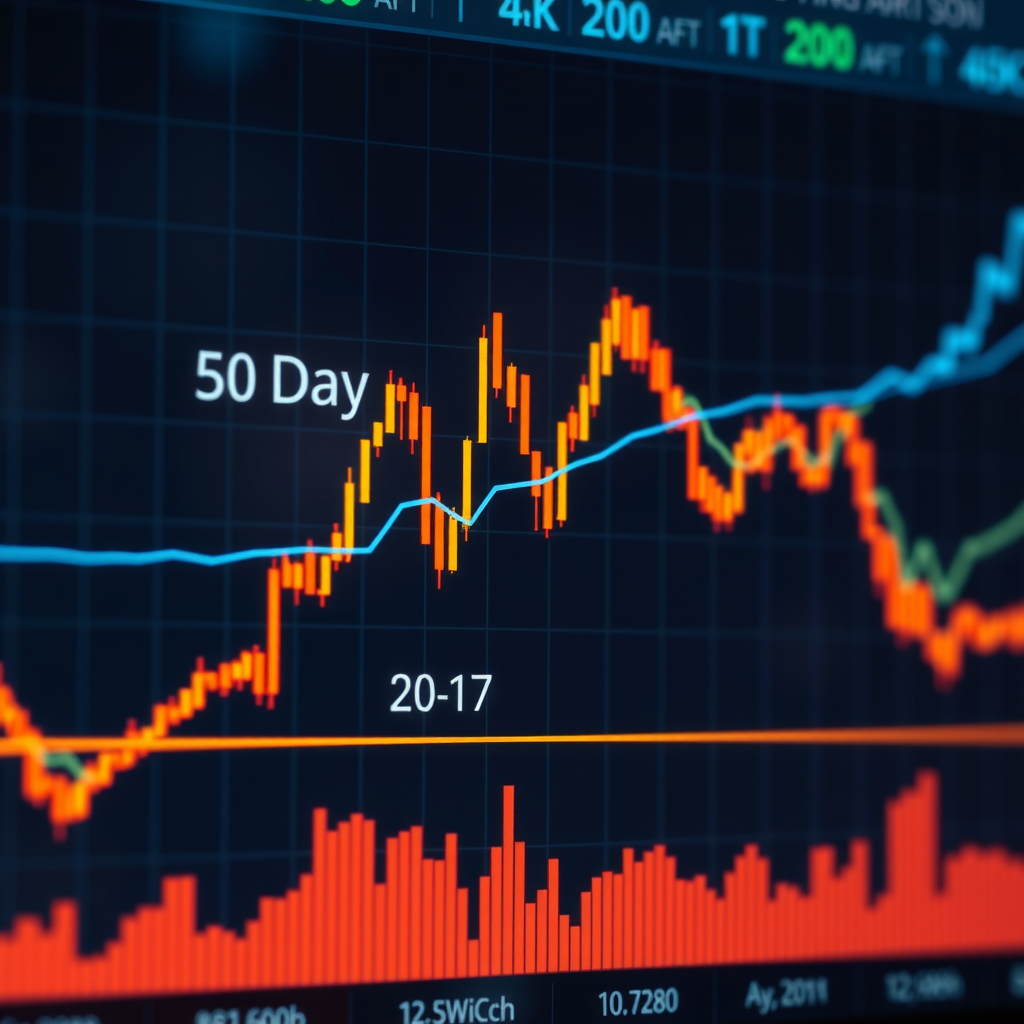
A Moving Average calculates the average price of an asset over a specific time period. For example, a 50-day Moving Average shows the average closing price over the last 50 days. As new data comes in, the oldest data point drops off, creating a "moving" average that follows the price trend.
- Uptrend Signal:When the price is consistently above the Moving Average, it suggests an upward trend
- Downtrend Signal:When the price stays below the Moving Average, it indicates a downward trend
- Support and Resistance:Moving Averages often act as dynamic support or resistance levels
How to Add Moving Averages to Your Chart
- Click the "Indicators" button at the top of your TradingView chart
- Type "Moving Average" in the search box
- Select "Moving Average" from the list (you'll see several types - start with the simple Moving Average)
- The indicator will appear on your chart with default settings
- Click the indicator name to adjust the period (common choices: 20, 50, or 200 days)
Beginner Strategy
Try using two Moving Averages together: a 50-day and a 200-day. When the shorter MA crosses above the longer MA, it's called a "golden cross" and often signals a potential buying opportunity. When it crosses below, it's a "death cross" suggesting caution.
2. Relative Strength Index (RSI): Spotting Overbought and Oversold Conditions
The Relative Strength Index is a momentum oscillator that measures the speed and magnitude of price changes. It's displayed as a line graph that moves between 0 and 100, helping you identify when an asset might be overbought or oversold.
Understanding RSI Readings
The RSI oscillates between 0 and 100, with traditional interpretation as follows:
- Above 70:The asset is potentially overbought, meaning it might be due for a price correction or pullback
- Below 30:The asset is potentially oversold, suggesting it might be undervalued and due for a bounce
- Around 50:Neutral territory, indicating balanced buying and selling pressure
Adding RSI to Your TradingView Chart
- Click "Indicators" at the top of your chart
- Search for "RSI" or "Relative Strength Index"
- Select it from the results
- The RSI will appear in a separate panel below your main price chart
- The default period is 14, which works well for most beginners
The RSI appears as a line that moves up and down in its own window below your price chart. You'll see horizontal lines at 30 and 70 marking the oversold and overbought zones.
Important Note
An overbought reading doesn't automatically mean "sell," and oversold doesn't always mean "buy." In strong trends, the RSI can stay in overbought or oversold territory for extended periods. Use RSI in combination with other indicators for better decision-making.
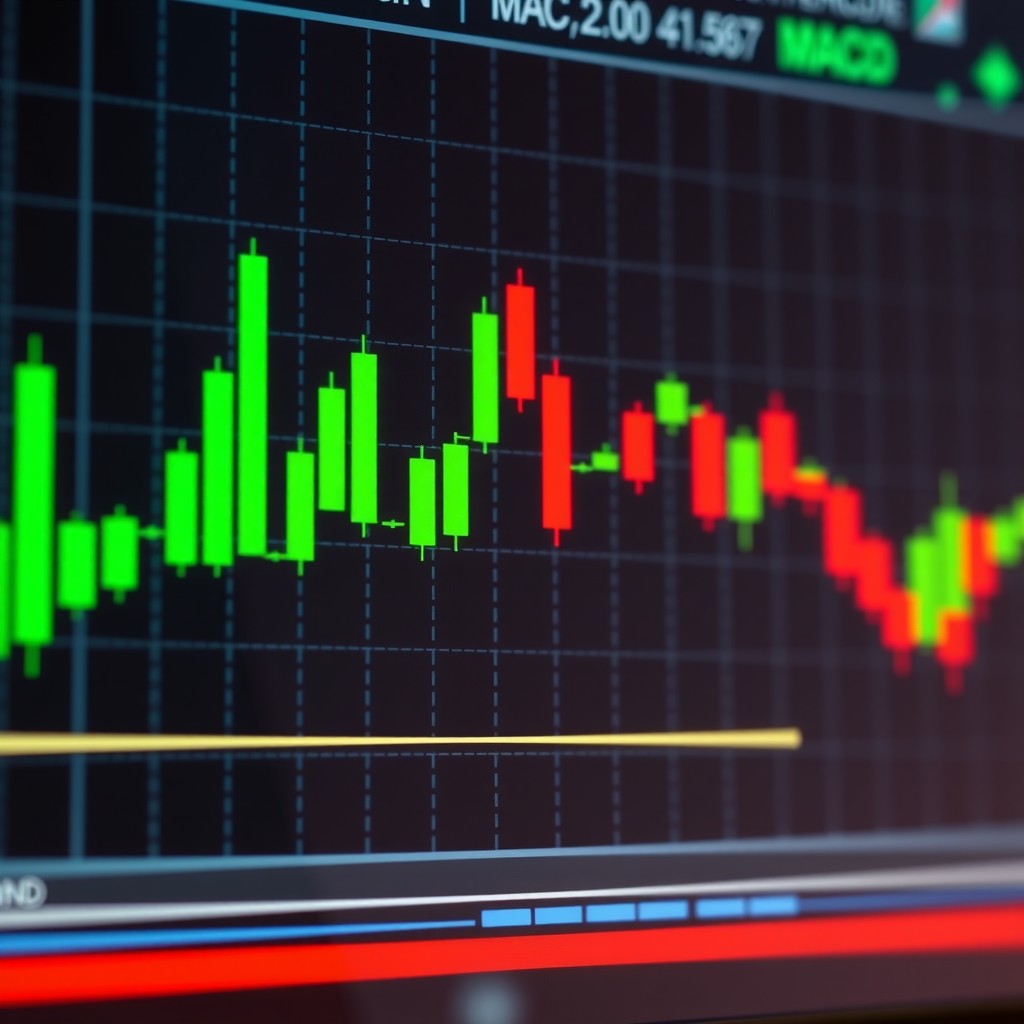
3. MACD (Moving Average Convergence Divergence): The Trend-Following Momentum Indicator
The MACD is one of the most versatile indicators in technical analysis, combining trend-following and momentum characteristics. While its name sounds complex, it's actually quite intuitive once you understand what you're looking at.
What the MACD Shows You
The MACD consists of three components that work together:
- MACD Line:The difference between two exponential moving averages (typically 12-day and 26-day)
- Signal Line:A 9-day moving average of the MACD line
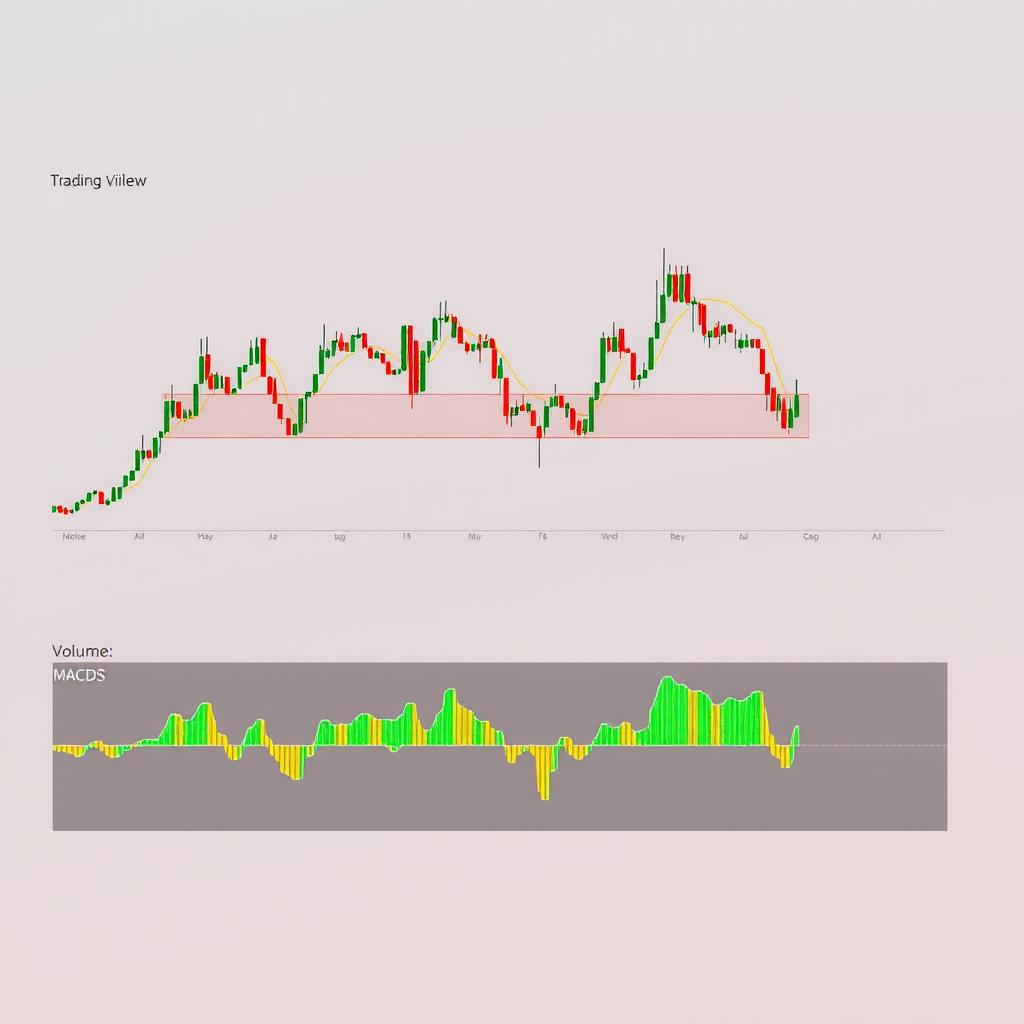
- Histogram:Visual representation of the difference between the MACD line and signal line
Reading MACD Signals
The MACD generates signals through crossovers and divergences:
- Bullish Crossover:When the MACD line crosses above the signal line, it suggests upward momentum
- Bearish Crossover:When the MACD line crosses below the signal line, it indicates downward momentum
- Zero Line Crossover:When the MACD crosses above or below zero, it confirms trend direction
- Histogram Growth:Growing histogram bars show increasing momentum in the current direction
How to Add MACD
- Click the "Indicators" button
- Type "MACD" in the search field
- Select "MACD" from the dropdown list
- The indicator appears in a separate panel with the histogram and two lines
- Default settings (12, 26, 9) work well for beginners
Pro Tip:The MACD works best in trending markets. In sideways or choppy markets, it can generate false signals. Combine it with trend indicators like Moving Averages for confirmation.
4. Bollinger Bands: Measuring Volatility and Price Extremes
Bollinger Bands are a volatility indicator that creates a channel around the price action. They expand and contract based on market volatility, helping you identify potential breakouts, reversals, and periods of consolidation.
Understanding the Three Bands
Bollinger Bands consist of three lines:
- Middle Band:A simple moving average (typically 20-period)
- Upper Band:Middle band plus two standard deviations
- Lower Band:Middle band minus two standard deviations
What Bollinger Bands Tell You
- Band Width:Wide bands indicate high volatility; narrow bands suggest low volatility and potential breakout
- Price at Upper Band:May indicate overbought conditions (but not always a sell signal)
- Price at Lower Band:May suggest oversold conditions (but not always a buy signal)
- Squeeze Pattern:When bands narrow significantly, it often precedes a strong price move
- Walking the Bands:In strong trends, price can "walk" along the upper or lower band
Adding Bollinger Bands
- Click "Indicators"
- Search for "Bollinger Bands"
- Select it from the list
- Three bands will appear directly on your price chart
- Default settings (20, 2) are suitable for most beginners
Beginner Strategy
Look for the "Bollinger Bounce" - when price touches the lower band and bounces back toward the middle band in an uptrend, or touches the upper band and falls back in a downtrend. This works best in ranging markets.
5. Volume: The Foundation of Price Movement
While technically not an indicator in the traditional sense, Volume is one of the most important pieces of information on any chart. It shows you how many shares, contracts, or units were traded during a specific time period, providing crucial context for price movements.
Why Volume Matters
Volume validates price movements and helps you distinguish between strong and weak trends:
- High Volume + Price Increase:Strong buying pressure, confirming upward movement
- High Volume + Price Decrease:Strong selling pressure, confirming downward movement
- Low Volume + Price Movement:Weak trend, likely to reverse or stall
- Volume Spikes:Indicate significant interest and potential trend changes
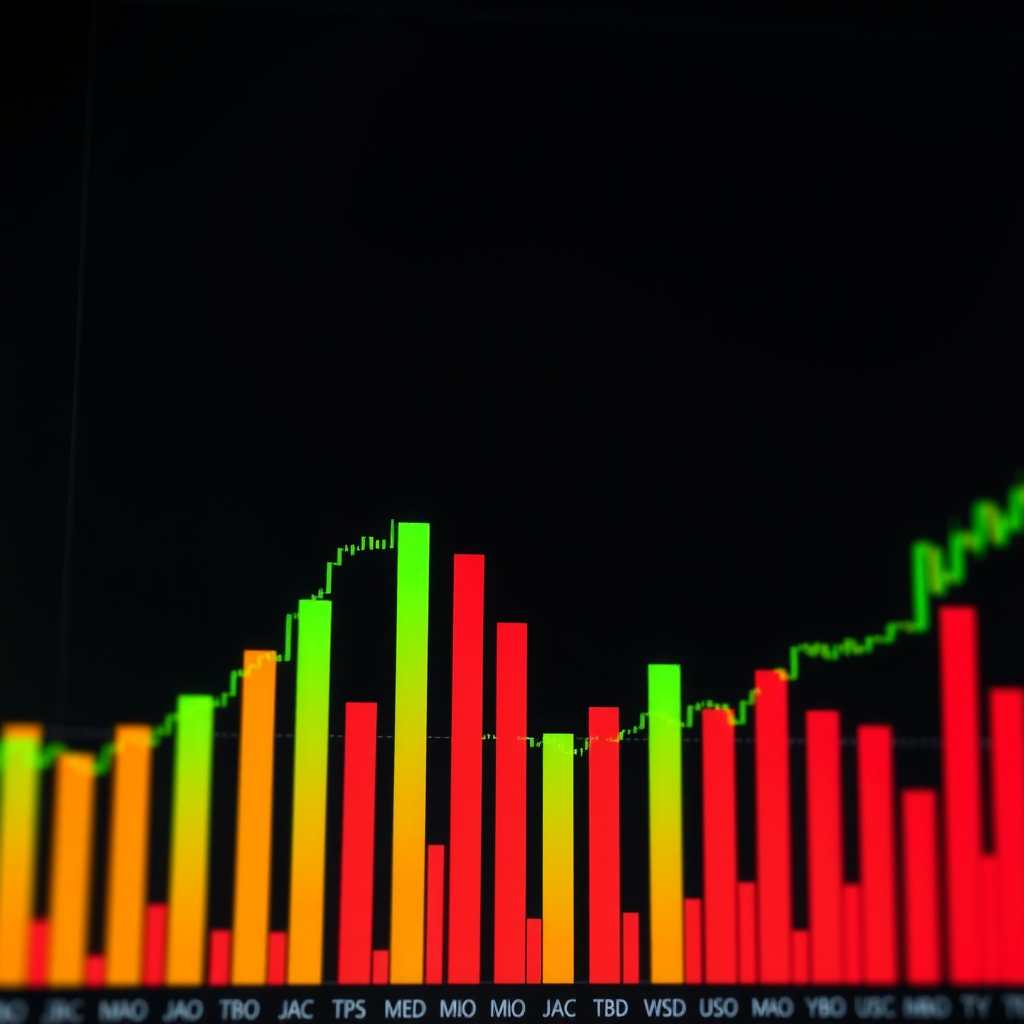
Reading Volume Bars
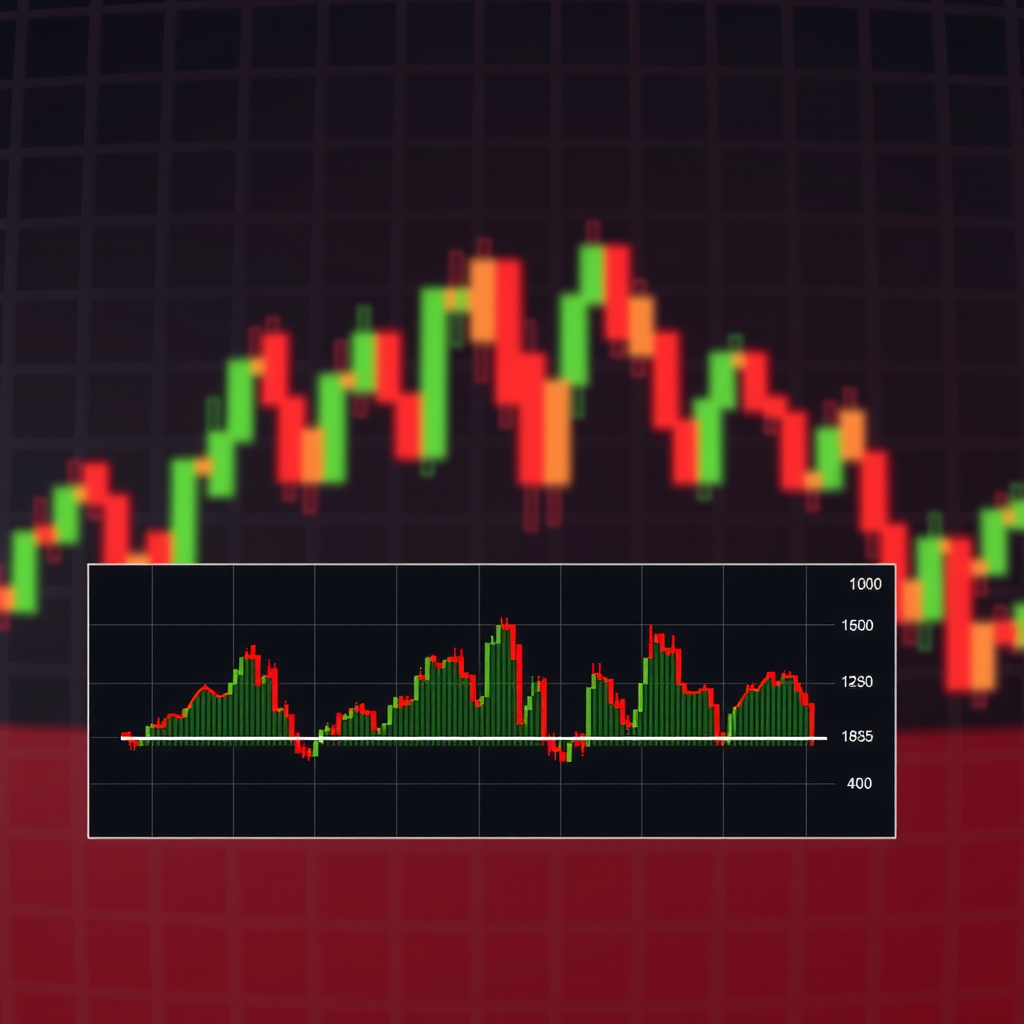
Volume appears as vertical bars at the bottom of your chart. In TradingView, these bars are typically color-coded:
- Green Bars:Volume on days when price closed higher than it opened
- Red Bars:Volume on days when price closed lower than it opened
- Taller Bars:Higher trading volume
- Shorter Bars:Lower trading volume
Enabling Volume Display
Volume is usually displayed by default in TradingView, but if you don't see it:
- Right-click on your chart
- Select "Settings" or click the gear icon
- Look for "Volume" in the settings menu
- Make sure it's enabled/checked
- Adjust the height of the volume panel by dragging the divider line
Key Principle
Always confirm price movements with volume. A price breakout on low volume is less reliable than one on high volume. Think of volume as the fuel that drives price movements - without sufficient volume, trends lack conviction.
Putting It All Together: A Beginner's Workflow
Now that you understand these five essential indicators, here's a simple workflow for using them together:
Step-by-Step Analysis Process
Step 1: Identify the Trend
Start with Moving Averages to determine the overall trend direction. Is the price above or below the MA? Are shorter MAs above or below longer ones?
Step 2: Check Momentum
Look at the RSI and MACD. Are they confirming the trend? Is momentum building or fading? Are there any divergences between price and indicators?
Step 3: Assess Volatility
Use Bollinger Bands to understand current volatility. Are the bands wide or narrow? Is price at an extreme (touching upper or lower band)?
Step 4: Confirm with Volume
Finally, check if volume supports the price action. High volume confirms strong moves; low volume suggests weak conviction.
Common Mistakes to Avoid
As you begin working with these indicators, watch out for these common pitfalls:
Indicator Overload
Don't add every indicator you can find to your chart. Start with 2-3 indicators and master them before adding more. Too many indicators create confusion and conflicting signals.
Ignoring Context
Indicators work differently in trending versus ranging markets. An RSI reading of 70 might be normal in a strong uptrend but could signal a reversal in a ranging market.
Trading Every Signal
Not every indicator signal is a trading opportunity. Wait for confirmation from multiple indicators and always consider the broader market context.
Forgetting Risk Management
Indicators help with analysis, but they don't eliminate risk. Always use proper position sizing, stop losses, and risk management regardless of what your indicators show.
Practice Makes Perfect
The best way to learn these indicators is through hands-on practice. Here's how to get started:
- Start with Paper Trading:Use TradingView's paper trading feature to practice without risking real money
- Focus on One Indicator at a Time:Spend a week just observing Moving Averages, then add RSI, and so on
- Keep a Trading Journal:Document what indicators showed before significant price moves
- Review Historical Charts:Look back at past price action and see how these indicators performed
- Join Trading Communities:Discuss indicator strategies with other beginners and experienced traders
Your Next Steps
Now that you understand these five essential indicators, it's time to put them into practice. Open TradingView, add these indicators to your chart one by one, and spend time observing how they behave in different market conditions.
Remember, becoming proficient with technical indicators is a journey, not a destination. Start simple, stay consistent, and gradually build your analytical skills. These five tools provide a solid foundation for your trading education, but they're just the beginning of what TradingView has to offer.