Drawing Tools on TradingView: A Practical Guide to Trendlines and Support Levels
Understanding how to use drawing tools effectively is one of the most valuable skills for any trader using TradingView. These visual tools help you identify trends, mark important price levels, and create a clear picture of market structure directly on your charts.
Getting Started with Drawing Tools
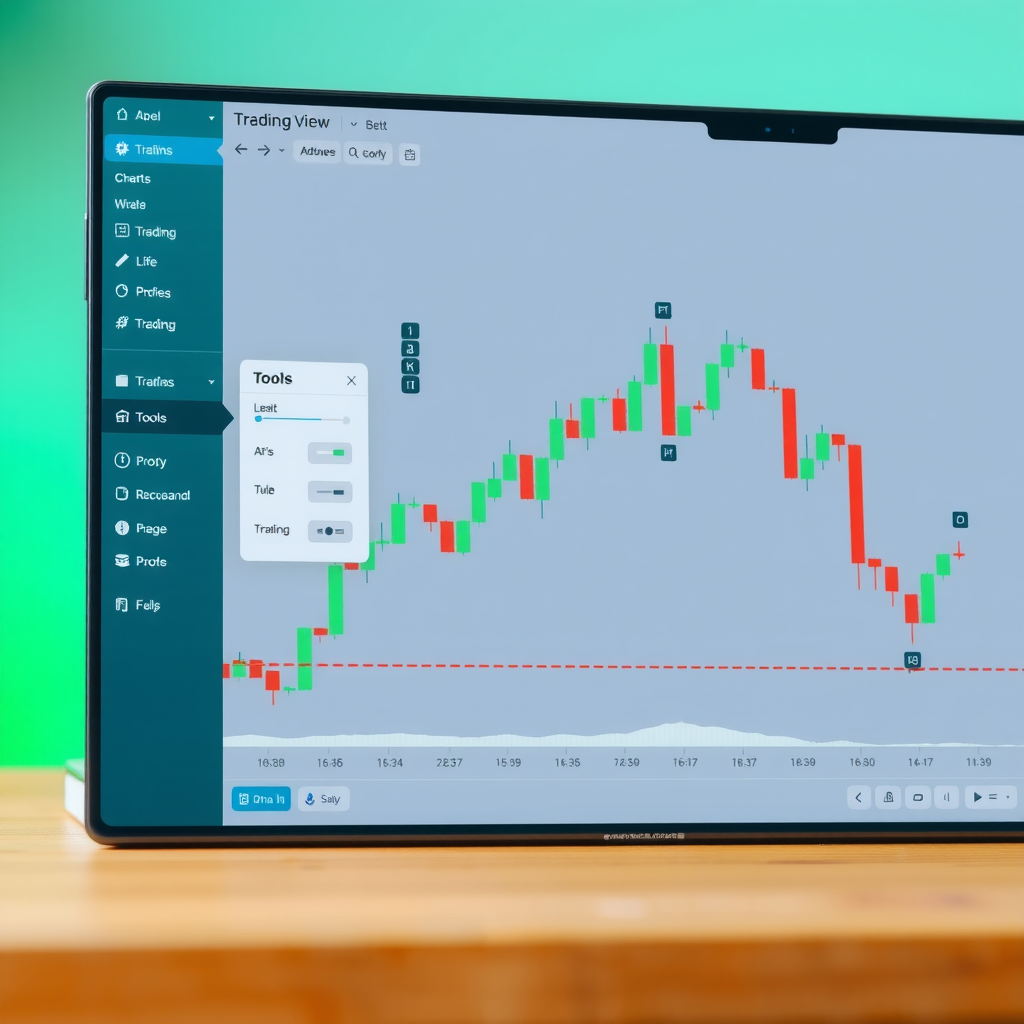
TradingView offers a comprehensive set of drawing tools accessible from the left-hand toolbar on your chart. For beginners, the most essential tools are trendlines, horizontal lines for support and resistance, and rectangles for marking key zones. These fundamental tools form the backbone of technical analysis and are used by traders at every skill level.
To access the drawing tools, look for the toolbar on the left side of your chart. You'll see various icons representing different drawing instruments. The most commonly used tools are located at the top of this panel for quick access. If you're just starting with TradingView, focus on mastering these basic tools before exploring more advanced options.
Pro Tip: Use the keyboard shortcut Alt+T (Windows) or Option+T (Mac) to quickly access the trendline tool without clicking through menus.
Drawing Trendlines: The Foundation of Technical Analysis
Trendlines are perhaps the most powerful and widely used drawing tool in technical analysis. They help you visualize the direction and strength of a trend by connecting significant price points. A properly drawn trendline can reveal potential entry and exit points, as well as areas where the price might reverse or continue its movement.
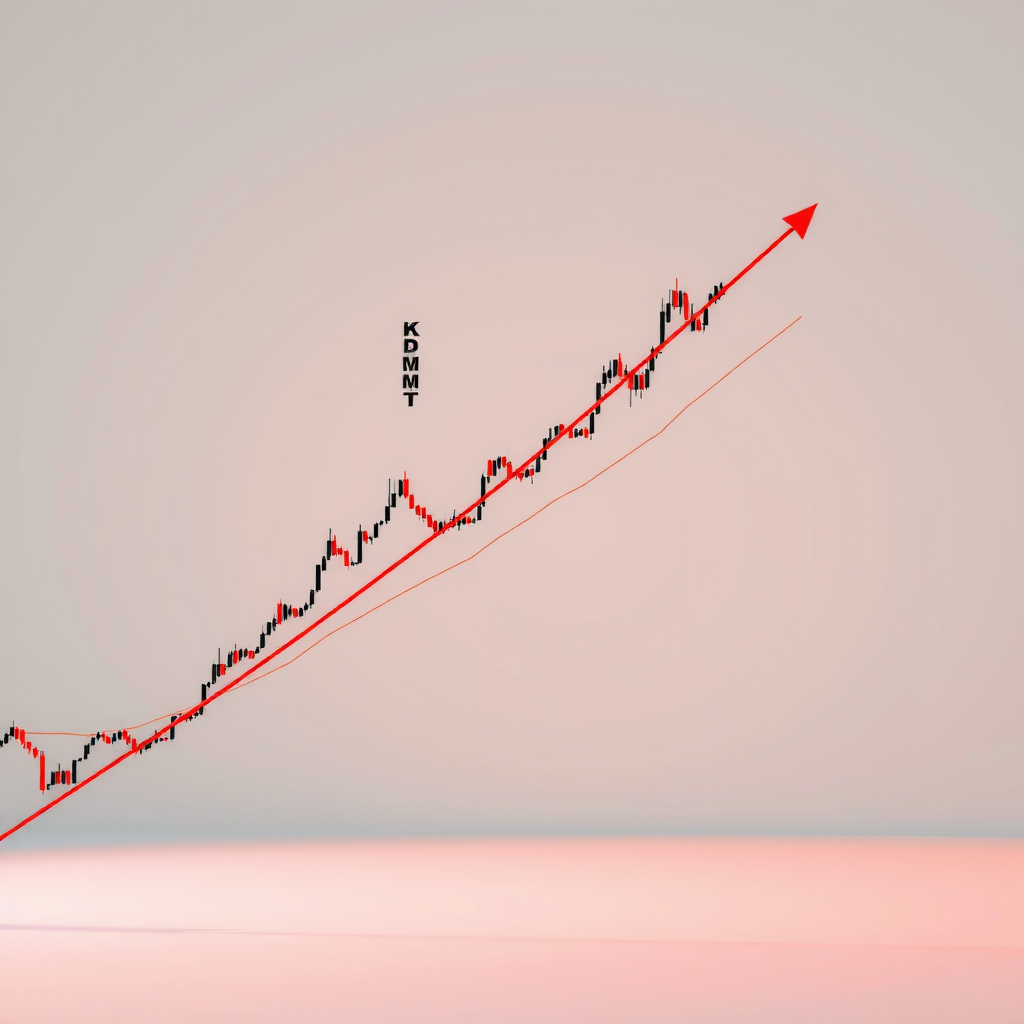
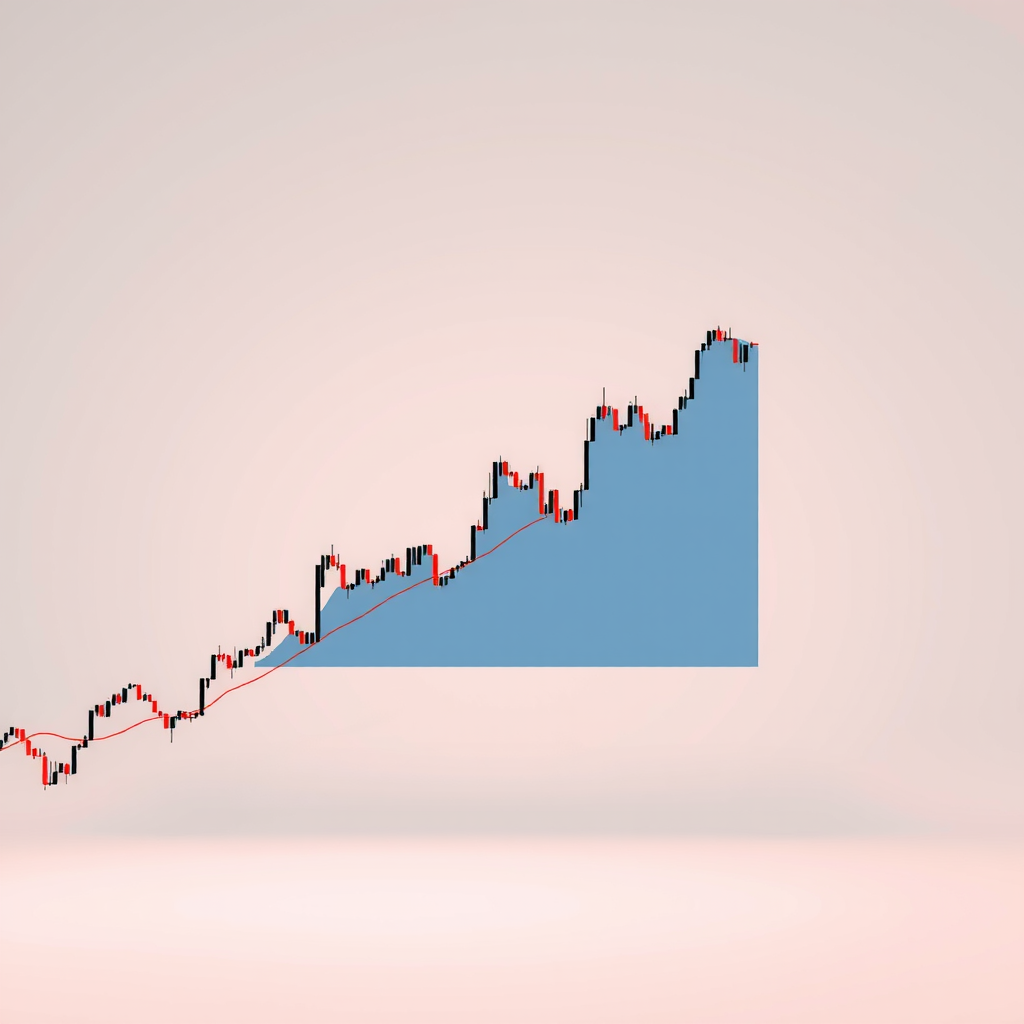
How to Draw an Uptrend Line
To draw an uptrend line, you need to identify at least two higher lows on your chart. Click on the trendline tool, then click on the first low point you want to connect. Move your cursor to the second higher low and click again. TradingView will automatically extend the line forward, showing you where the trend might continue.
The key to drawing effective uptrend lines is patience and precision. Don't force a trendline to fit your bias. Instead, let the price action guide you. Look for clear swing lows where the price has bounced multiple times. The more times the price respects your trendline, the more significant it becomes as a support level.
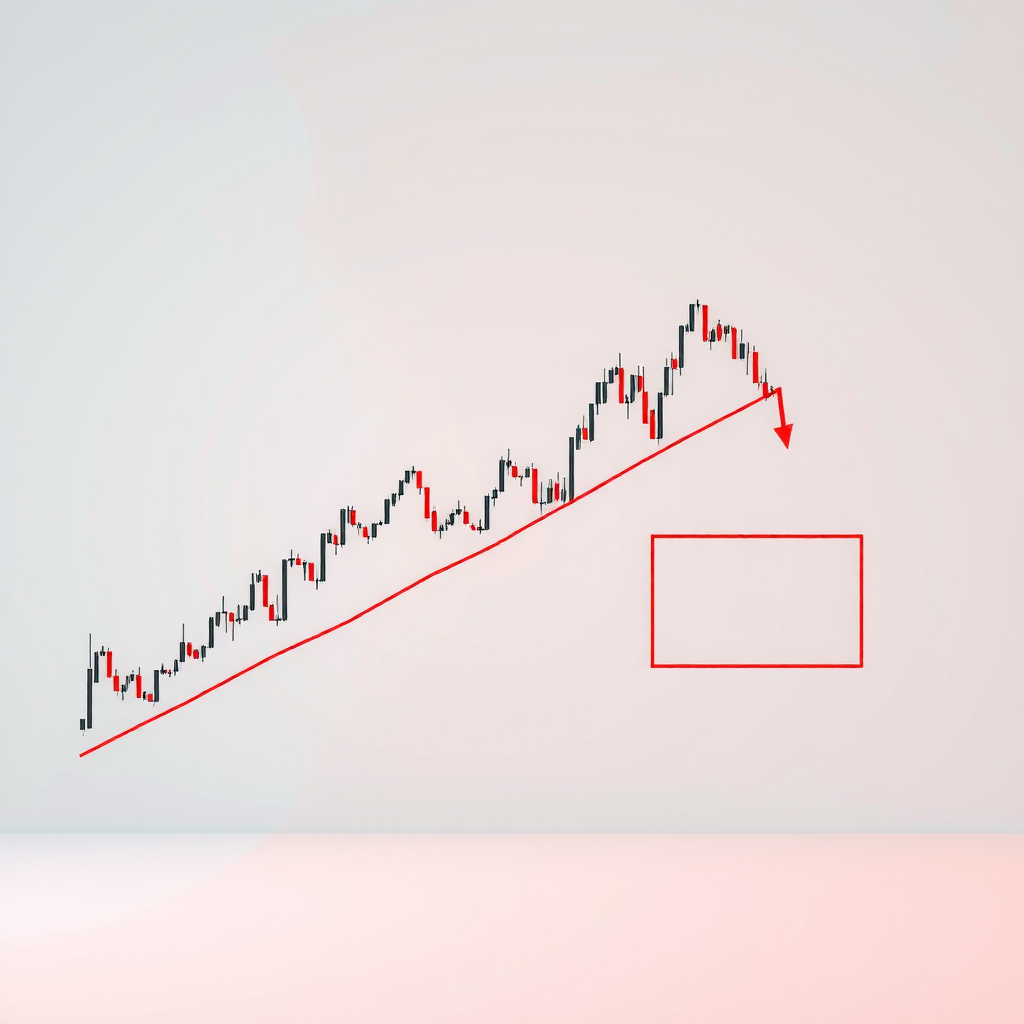
Drawing Downtrend Lines
Downtrend lines work on the same principle but in reverse. You'll connect two or more lower highs to create a line that slopes downward. This line acts as resistance, showing where selling pressure has consistently pushed the price down. When drawing downtrend lines, focus on the peaks where the price has failed to break higher.
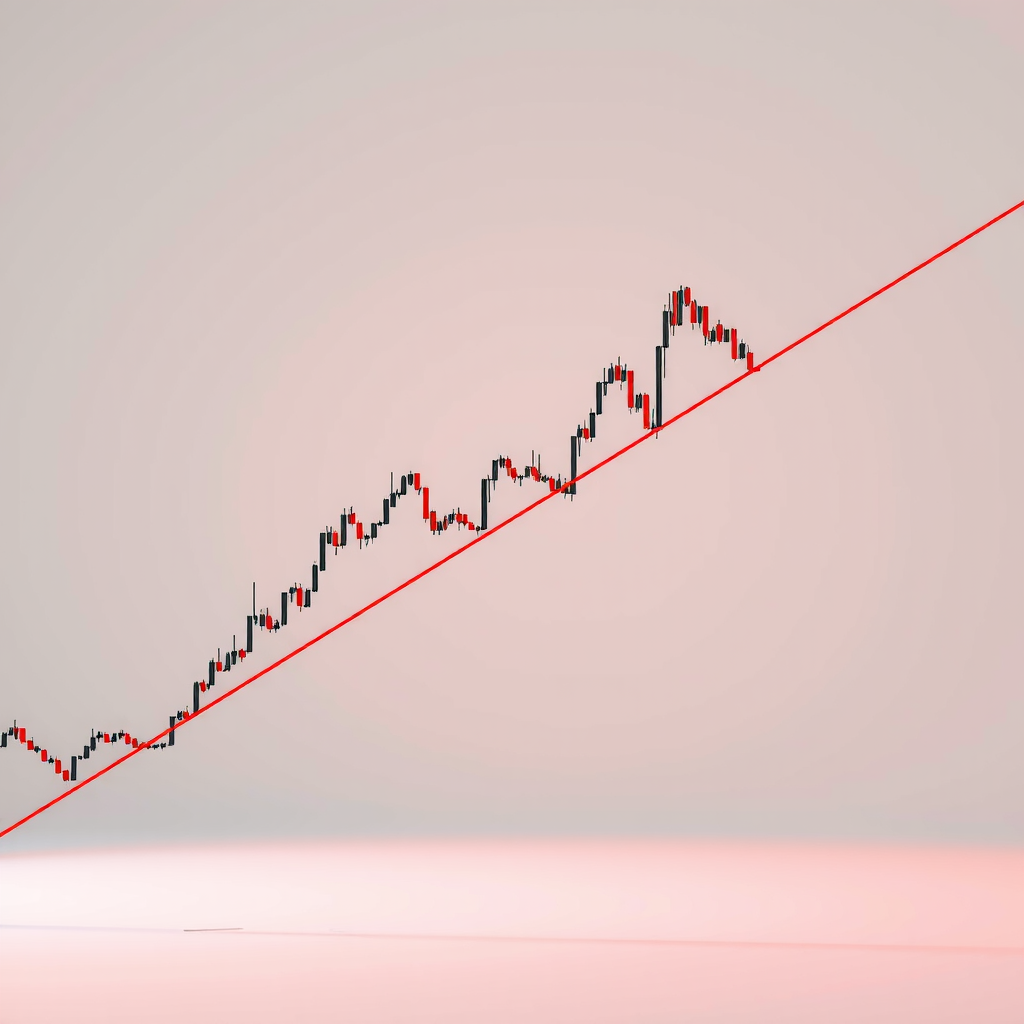
One common mistake beginners make is trying to connect every single high or low. Remember, trendlines are meant to show the overall direction of the trend, not every minor fluctuation. It's perfectly normal for the price to occasionally pierce through your trendline slightly. What matters is whether the price closes beyond the line or just wicks through it temporarily.
Identifying and Marking Support Levels
Support levels are price points where buying pressure is strong enough to prevent the price from falling further. These levels are crucial for identifying potential entry points and setting stop-loss orders. On TradingView, you can mark support levels using horizontal lines, which are found in the drawing tools panel.
To draw a support level, select the horizontal line tool and click on a price level where you've noticed the price bouncing multiple times. The line will extend across your entire chart, making it easy to see when the price approaches this important level again. Support levels often form at round numbers, previous lows, or areas where significant buying activity occurred in the past.
What Makes a Strong Support Level
Not all support levels are created equal. A strong support level typically has several characteristics: it has been tested multiple times without breaking, it coincides with other technical factors like moving averages or Fibonacci levels, and it shows significant volume when the price bounces from it. When marking support on your charts, prioritize levels that meet these criteria.
Remember: The more times a support level is tested and holds, the more significant it becomes. However, each test also weakens it slightly, so be prepared for eventual breaks.
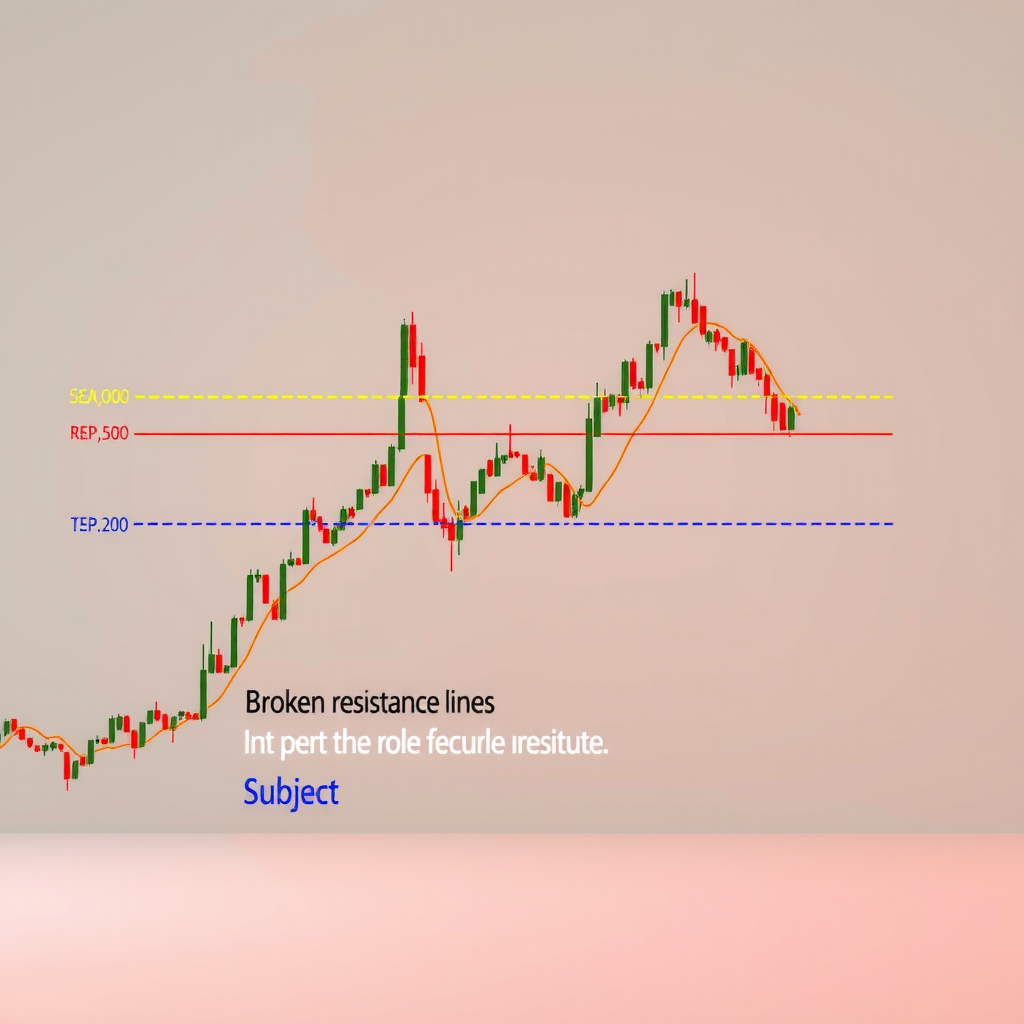
Understanding Resistance Levels
Resistance levels are the opposite of support—they're price points where selling pressure prevents the price from rising further. Just like support levels, you mark resistance using horizontal lines on TradingView. These levels help you identify potential exit points for long positions or entry points for short positions.
When identifying resistance levels, look for areas where the price has repeatedly failed to break higher. Previous highs, round numbers, and areas of heavy selling volume often act as resistance. It's also important to note that when a resistance level is finally broken, it often becomes a new support level—a concept known as role reversal.
Using Rectangles to Mark Key Zones
While horizontal lines are useful for marking specific price levels, sometimes support and resistance exist as zones rather than exact prices. This is where the rectangle tool becomes invaluable. Rectangles allow you to highlight areas where the price has consolidated or where significant buying and selling activity has occurred.
To use the rectangle tool, select it from the drawing tools panel and click to set one corner of your rectangle. Drag to the opposite corner to define the zone you want to highlight. You can adjust the transparency and color of the rectangle to make it stand out without obscuring the price action underneath.
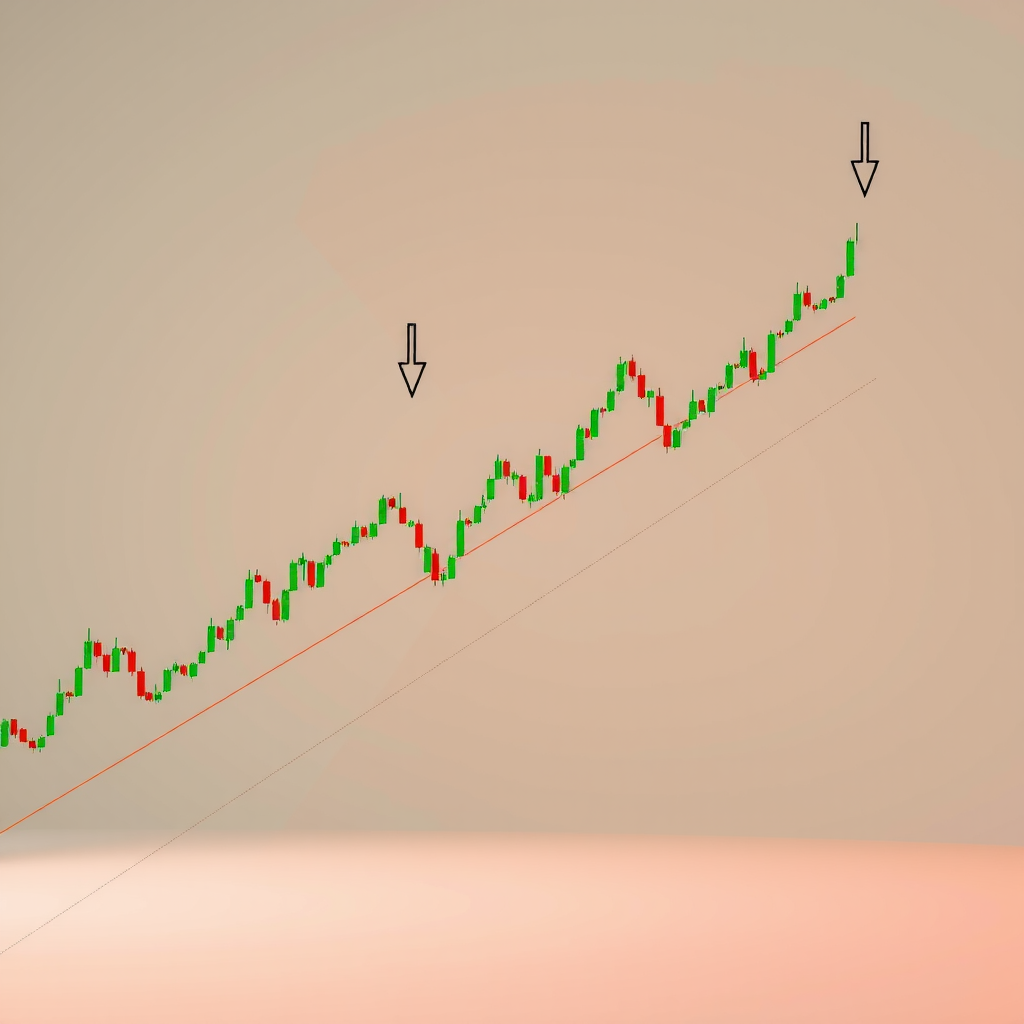
Marking Consolidation Zones
Consolidation zones are areas where the price moves sideways, neither trending up nor down significantly. These zones often precede major price movements, making them important to identify. Use rectangles to mark these areas on your chart. When the price breaks out of a consolidation zone, it often moves strongly in the direction of the breakout.
Customizing Your Drawing Tools
TradingView allows you to customize the appearance of your drawing tools to match your preferences and improve chart readability. After drawing a line or shape, you can right-click on it to access settings. Here you can change the color, thickness, style (solid, dashed, dotted), and even add text labels to your drawings.
Many traders develop a color-coding system for their drawings. For example, you might use green for support levels, red for resistance, and blue for trendlines. This visual organization makes it easier to quickly understand your chart analysis at a glance. You can also adjust the transparency of rectangles and other filled shapes to ensure they don't hide important price action.
Tip: Save your favorite drawing tool settings as defaults in TradingView preferences. This ensures consistency across all your charts and saves time when creating new drawings.
Managing and Organizing Your Drawings
As you become more comfortable with drawing tools, your charts may start to look cluttered with multiple lines and shapes. TradingView provides several features to help you manage this complexity. You can lock drawings to prevent accidental modifications, hide specific drawings temporarily, or delete outdated analysis that's no longer relevant.
The object tree, accessible from the right-hand panel, shows all drawings on your current chart. From here, you can quickly select, hide, or delete multiple drawings at once. This is particularly useful when you want to clean up your chart or focus on specific aspects of your analysis. You can also create drawing templates that include your most commonly used lines and levels, which can be applied to new charts instantly.
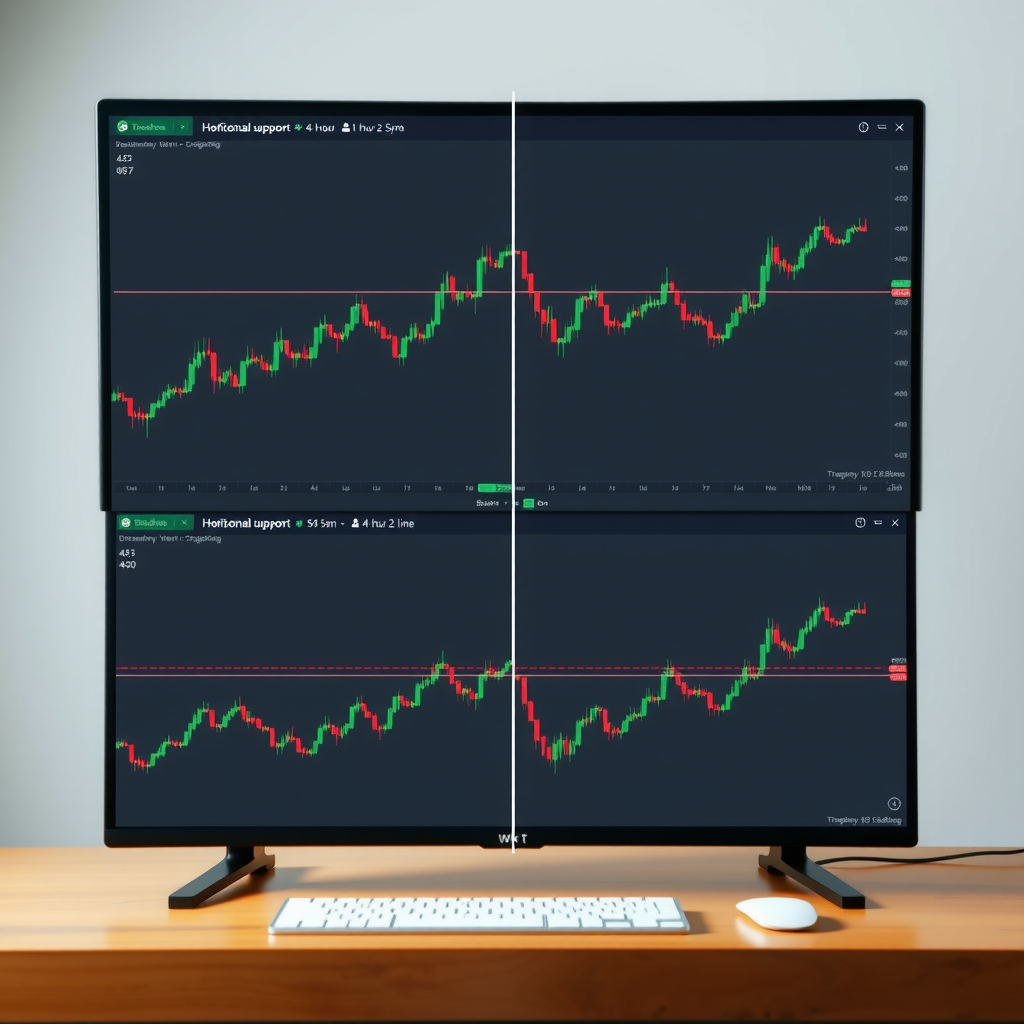
Using Drawing Sync Across Timeframes
One powerful feature of TradingView is the ability to sync your drawings across different timeframes. When you draw a trendline or support level on a daily chart, you can choose to have it appear on hourly or weekly charts as well. This helps maintain consistency in your analysis and allows you to see how key levels align across multiple timeframes.
Common Mistakes to Avoid
Even experienced traders sometimes fall into common traps when using drawing tools. One frequent mistake is over-analyzing by drawing too many lines on a single chart. This creates confusion rather than clarity. Focus on the most significant levels and trends, and remove outdated drawings regularly to keep your charts clean and readable.
Another common error is forcing trendlines to fit a predetermined bias. If you have to skip multiple price points or adjust your line significantly to make it work, it's probably not a valid trendline. Let the price action guide your analysis rather than trying to make the chart confirm what you want to see. Remember, the market doesn't care about your drawings—your drawings should reflect what the market is actually doing.
Finally, many beginners forget that support and resistance levels are not exact prices but rather zones. The price might slightly overshoot or undershoot a level before reversing. Don't be too rigid in your interpretation. Allow for some flexibility and consider the overall context of the price action rather than focusing solely on whether a specific price point was touched.
Practical Exercise: Drawing Your First Analysis
Now that you understand the basics, it's time to practice. Open TradingView and select a chart of any asset you're interested in. Start by identifying the overall trend—is it moving up, down, or sideways? Draw a trendline connecting the most obvious swing points. Don't worry about perfection; the goal is to get comfortable with the tools.
Next, look for obvious support and resistance levels. Mark at least two of each using horizontal lines. Try to find levels that have been tested multiple times. Finally, if you notice any consolidation zones, use the rectangle tool to highlight them. Step back and look at your chart—does your analysis make the price action clearer? If not, try simplifying by removing less significant drawings.
Practice Tip: Spend 15 minutes each day analyzing different charts with drawing tools. Over time, you'll develop an intuitive sense for where to place trendlines and identify key levels quickly.
Taking Your Analysis Further
Once you're comfortable with basic trendlines and support/resistance levels, you can explore more advanced drawing tools. TradingView offers Fibonacci retracements, channels, pitchforks, and many other tools that build upon these fundamentals. However, don't rush to use advanced tools until you've mastered the basics. A simple, well-drawn trendline is often more valuable than a complex analysis that you don't fully understand.
Remember that drawing tools are just one part of a complete trading strategy. They should be used in conjunction with other forms of analysis, including indicators, volume analysis, and fundamental research. The goal is to develop a comprehensive understanding of market behavior, not to rely on any single tool or technique.
As you continue your journey with TradingView, keep practicing with these fundamental drawing tools. They form the foundation of technical analysis and will serve you well regardless of which markets you trade or what strategies you develop. The key is consistent practice and honest evaluation of your analysis. Over time, you'll develop the skill to quickly identify important levels and trends, making you a more confident and effective trader.
Final Thought: The best technical analysis is simple, clear, and actionable. If your chart looks like a maze of lines, you've probably gone too far. Focus on quality over quantity in your drawings.